PCA Slides

Brandy Carr

Lee

Tavish

What is it?

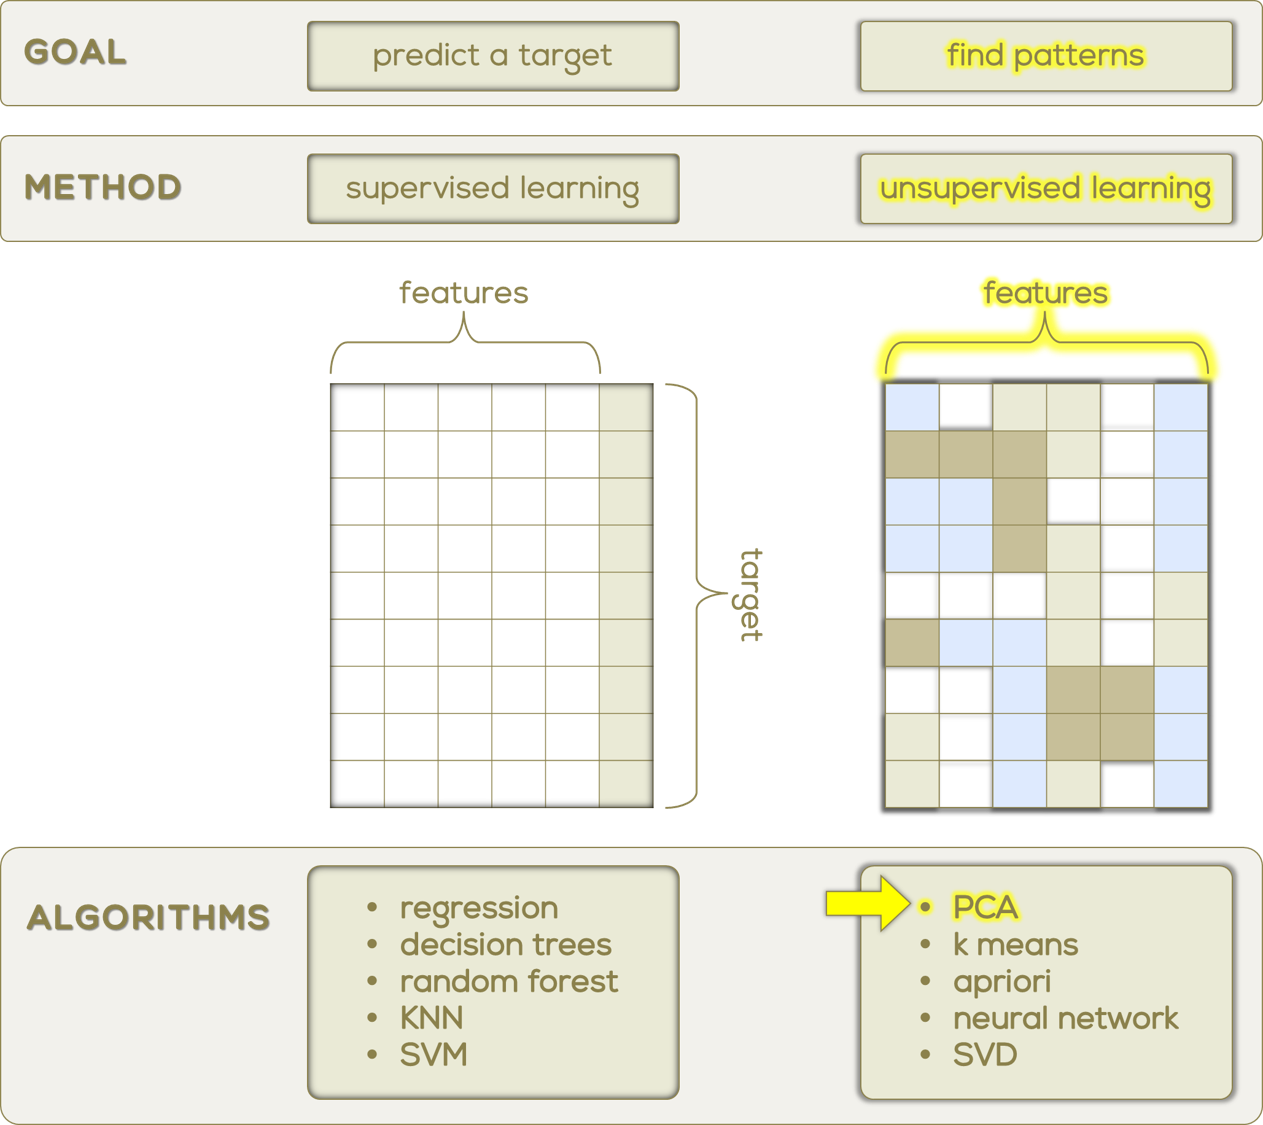
  • Principal component analysis (PCA) is an unsupervised machine learning method used as the first step in data analysis
  • Main goal: reduce the number of dimensions/features while retaining most of the original variability
  • This is achieved using a vector space transform

Why use PCA?


  • Makes it easier to graphically visualize hidden patterns in the data
  • High number of predictor variables or highly correlated variables when running a regression model
  • To observe hidden trends, jumps, clusters, patterns and outliers
  • PCA assumes no distribution in data in a descriptive context
  • Widely adaptive as an exploratory method across disciplines and data types

Where has PCA been applied?


  • PCA is a broadly used statistical method whose use stretches across many scientific disciplines
  • Image analysis, analysis of web data, cyber security analysis, mental disorders, recognizing microanerysm, facial recognition, etc.
  • Many different adaptations of PCA have been developed based on the variation in goals and data types associated with each respective discipline

How does it work?


  • By mathematical projection we can interpret the original data set with just a few variables, namely the principal components
  • The process of reduction preserves the maximum variability in the data (i.e. the statistical information present in the data)
  • “…find new variables that are linear functions of those in the original data set, that successively maximize variance and that are uncorrelated with each other” (Jolliffe IT 2016)

Methods


  • PCA is an unsupervised machine learning tool used to find hidden patterns in multivariate datasets.
  • It is often used as the 1st step when preforming other multivariate methods such as:
    • multiple regression
    • cluster analysis
    • discriminant analysis
  • The main goal is to take the original correlated variables and project them into a new set of smaller uncorrelated variables, the principal components. (dimension reduction)
  • PCA is the most beneficial when the first 2 PC’s (combined) explain over 80% of the variance.
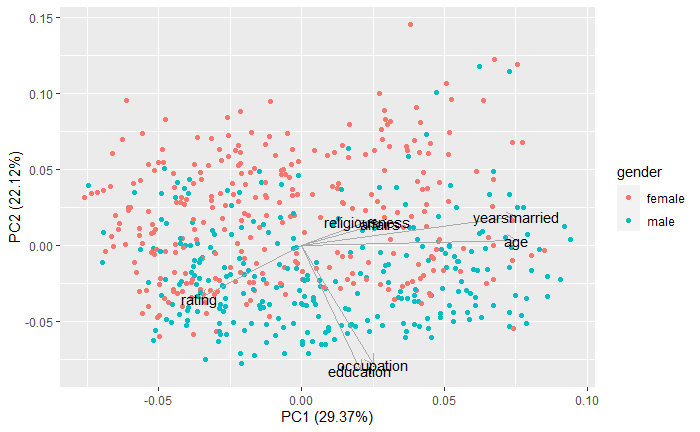
  • Most often only the first 2 PC’s are of importance because it is easiest te represent visually, with the 1st PC as the xaxis, the 2nd as the yaxis, and the eigenvectors (loadings) represented as arrows originating from the center of the plot.

Assumptions & Process


  1. Variables should be continuous, interval or ratio level of measurement (ordinal variables, such as likert-scale, are also often used)
  1. Variables should all be the same scale/units & if not, they should be standardized
  1. Variables are linearly related
  1. Outliers & missing or impossible values should be removed

%%{init: {'theme': 'base', 'themeVariables': {'mainBkg': '#FAFAF5', 'background': '#FAFAF5', 'primaryColor': '#EAEAD6', 'nodeBorder': '#8B814C', 'lineColor': '#8B814C', 'primaryTextColor': '#191970', 'textColor': '#191970', 'fontSize': '12px', 'width': '100%'}}}%%

flowchart LR
A[(Clean<br/>Data)] --> B((Are all<br/>vars the same<br/>scale/unit?))
B --> C((Yes))
B --> D((No))
D -.- |Standardize<br/>Data| E(Estimate<br/>Sample<br/>Mean<br/>Vector)
C --> E
D --> F(Estimate<br/>Sample<br/>Mean<br/>Vector)
E --> G(Estimate<br/>Sample<br/>Covariance<br/>Matrix)
F --> H(Estimate<br/>Sample<br/>Correlation<br/>Matrix)
G --> I(Eigenvalues<br/>Eigenvectors)
H --> I

Sample data

  • COLUMNS: Variables
  • ROWS: Observations

Figure 1: Sample Data

Equations


\[{\sf Standardize\ Data:}\ \ \ \ \ \ \ \ {z_{ij}}\ =\ \frac{{x_{ij}} - {\overline{x_j}}} {\sqrt{\hat{\sigma_{jj}}}}, \ \ \ \ \ where\ \ \ \ i\ =\ \{1,2,...,n\}, \ \ \ \ j\ =\ \{1,2,...,p\} \qquad(1)\]

\[{\sf Random\ Vector:}\ \ \ \ \ \ \ \ {x_i} = {({x_{i1}}, ... , {x_{ip}})}^T,\ \ \ \ \ \ \ \ \ where\ \ i\ =\ \{1,2,...,n\} \qquad(2)\]

\[{\sf Sample\ Mean\ Vector:}\ \ \ \ \ \ \ \ \hat{\mu}\ \ =\ \ \overline{x}\ \ =\ \ \frac{1}{n} \sum_{i=1}^{n} x_i \qquad(3)\]

\[{\sf Sample\ Covariance\ Vector:}\ \ \ \ \ \ \ \ \hat{\sum}\ \ =\ \ S\ \ =\ \ {(\hat{\sigma}_{ij})}_{p{\sf x}p}\ \ =\ \ \frac{1}{n-1} \sum_{i=1}^{n} {(x_i - \overline{x})(x_i - \overline{x})}^T \qquad(4)\]

\[{\sf Eigenvectors:}\ \ \ \ \ \ \ \ {\hat{a}_{k}} \qquad(5)\]

\[{\sf Eigenvalues:}\ \ \ \ \ \ \ \ {\hat{y}_{ik}}\ =\ {\hat{a}^T_{k}}(x_i\ -\ \overline{x}),\ \ \ \ \ \ \ i\ =\ \{1,2,...,n\},\ \ \ \ \ \ \ k\ =\ \{1,2,...,p\} \qquad(6)\]
Data

Replication Data & Code

(Oliver and Wood 2013)

  • 2,000 respondents answering a 5-point Likert scale on their belief in various conspiracies
  • Grouped by political ideology
  • Sampled from a nationally representative survey in 2011
  • Very Liberal
  • Liberal
  • Somewhat Liberal
  • Middle of the Road
  • Somewhat Conservative
  • Conservative
  • Very Conservative

All variables were measured using a 5-point likert scale: \[Strongly\ Disagree\ (1)\ <\ Disagree\ (2)\ <\ Neutral\ (3)\ <\ Agree\ (4)\ <\ Strongly\ Agree\ (5)\]

  1. truther911: Certain U.S. government officials planned the attacks of September 11, 2001, to incite war
  2. obamabirth: President Barack Obama was not really born in the US and does not have an authentic Hawaiian birth certificate
  3. fincrisis: The current financial crisis was secretly orchestrated by a small group of Wall Street bankers to extend the power of the Federal Reserve and further their control of the world’s economy
  4. flourolights: The U.S. government is mandating the switch to compact fluorescent light bulbs because such lights make people more obedient and easier to control
  5. endtimes: We are currently living in End Times as foretold by Biblical prophecy
  6. sorosplot: Billionaire George Soros is behind a hidden plot to destabilize the American government, take control of the media, and put the world under his control
  7. iraqjews: The U.S. invasion of Iraq was driven by oil companies and Jews in the U.S. and Israel
  8. vaportrail: Vapor trails left by aircraft are actually chemical agents deliberately sprayed in a clandestine program directed by government officials

Check Assumptions

Figure 2: Distributions

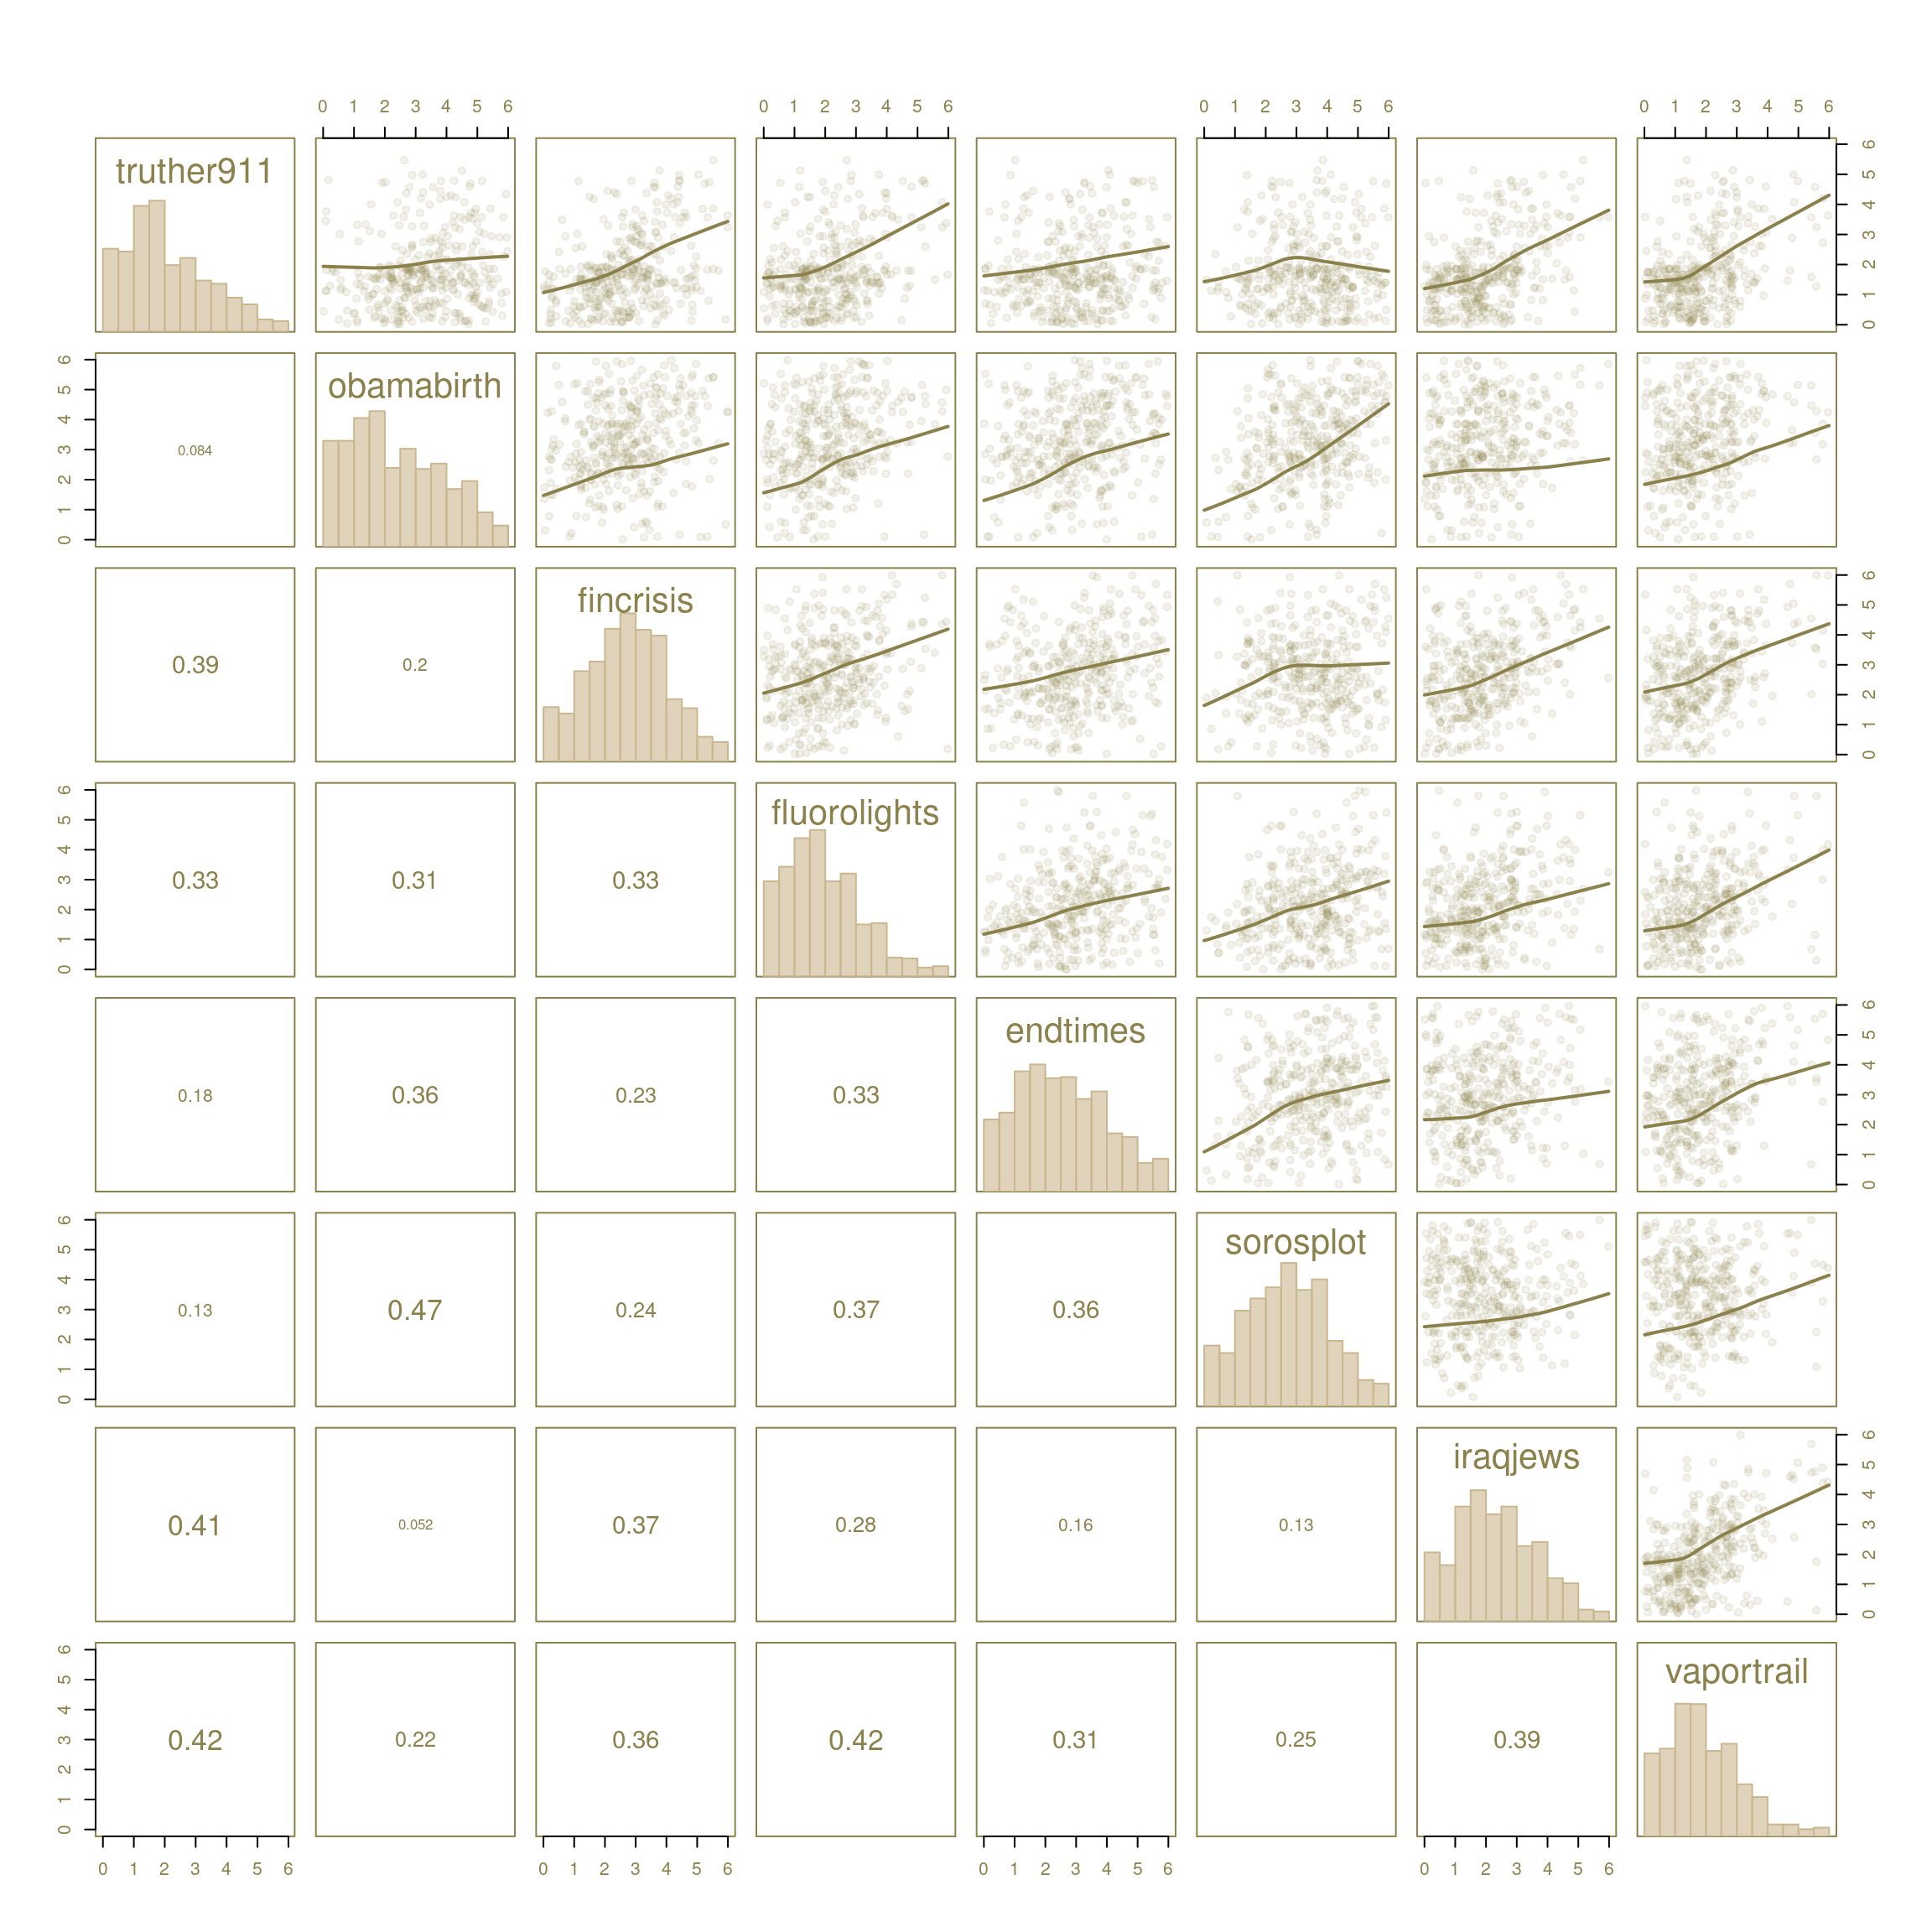
Figure 3: Correlation Matricies

Screeplot

PCA Biplot with Political Ideology Clusters

Figure 4: Loadings

Figure 5: Biplot

Good Examples

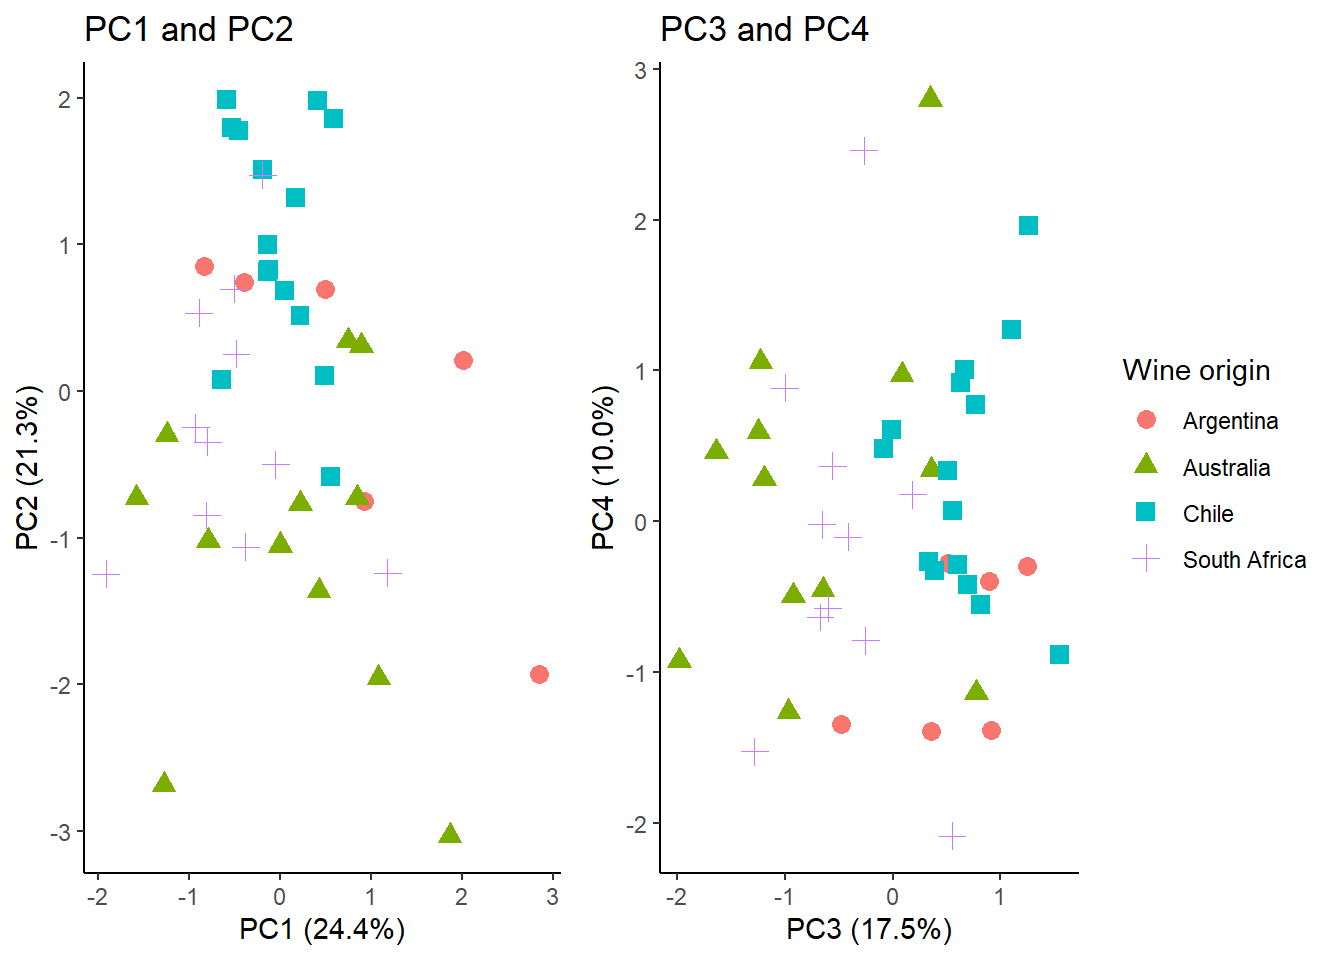
Figure 6: Good Example 1 (Martíni et al. 2021)

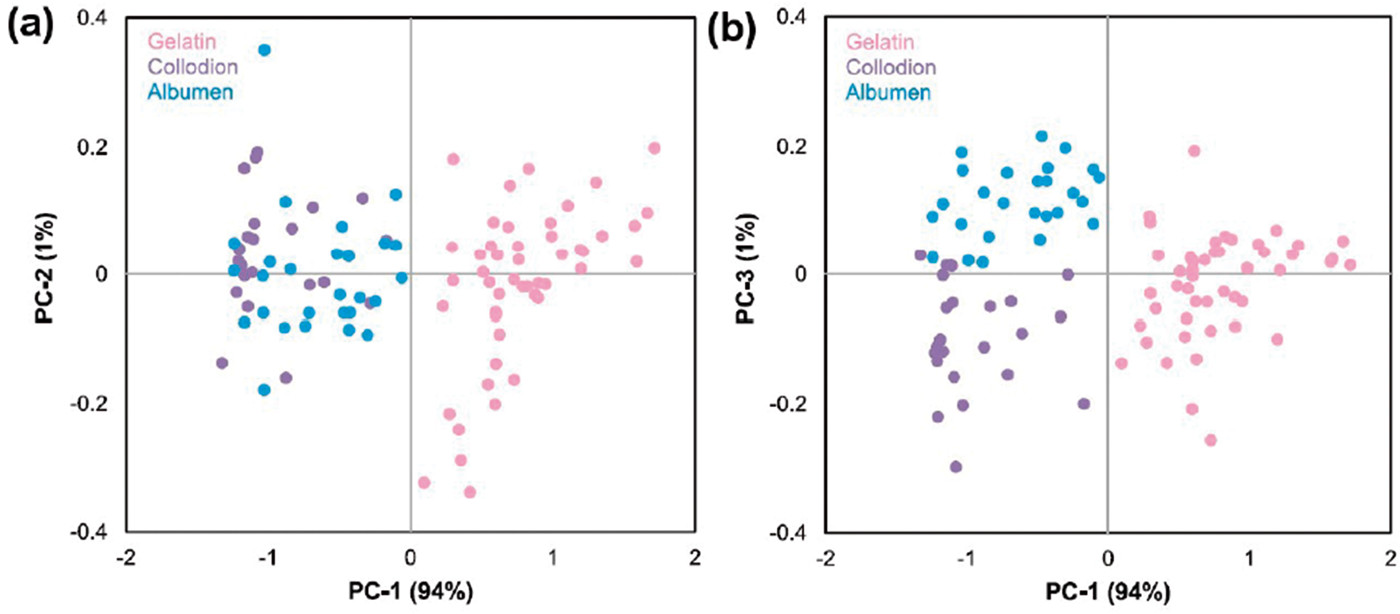
Figure 7: Good Example 2 (Grabska, Beć, and Huck 2021)

Bad Examples

Figure 8: Bad Example 1 (Juan Pablo 2021)

Figure 9: Bad Example 2 (badEx2?)

Conclusion

  • PCA is a very powerful tool for data analysis. It allows us to see patterns and trends hidden in large sets of data that would otherwise be very difficult to make out.
  • In our conclusion of Data, we saw that Scree-plot Proportion of Variance 0.4256 0.2027 0.09081 0.0669 0.06306 0.05966 0.05214 0.03907 and as well that plot dropped 10% from variances after Comp 3.
  • We focus on the Assumptions we ensure the variables are continuous, intervals or ratio levels of measurements are also of the same scale and units.
  • We also make sure in our dataset that the variables are linearly related, and we use the scatterplot to check the variables. Lastly, we ensure Outliers are removed and those Null values that are missing are noted and removed
  • PCA has been found to be useful when performing k-means clustering which by itself is a clustering method with countless applications. With all of the flexibility and usefulness of PCA taken into consideration it is easy to see why it is such a popular way to analyze large data sets across so many fields.
  • As long as there are large data sets there will be a demand to reduce the dimension of that data and make valid interpretations about the trends present in that data, to this end we have PCA.

End

Grabska, Justyna, Krzysztof B Beć, and Christian W Huck. 2021. “Novel Near-Infrared and Raman Spectroscopic Technologies for Print and Photography Identification, Classification, and Authentication.” NIR News 32 (1-2): 11–16. https://doi.org/10.1177/09603360211003757.
Jolliffe IT, Cadima J. 2016. “Principal Component Analysis: A Review and Recent Developments.” Philosophical Transactions A.
Juan Pablo. 2021. “Principal Component Analysis (PCA) from Scratch.”
Martíni, Aline Fachin, Gustavo Pereira Valani, Laura Fernanda Simões da Silva, Denizart Bolonhezi, Simone Di Prima, and Miguel Cooper. 2021. “Long-Term Trial of Tillage Systems for Sugarcane: Effect on Topsoil Hydrophysical Attributes.” Sustainability 13 (6). https://doi.org/10.3390/su13063448.
Oliver, J. Eric, and Thomas J. Wood. 2013. Replication data for: Conspiracy Theories and the Paranoid Style(s) of Mass Opinion.” Harvard Dataverse. https://doi.org/10.7910/DVN/22976.